


Bring your question.
Open a saved plan, capture one from a live connection, or find an expensive statement in Query digest. Slow log files work offline, too.
Workload › Top statements
See where your queries spend their time.
Explore plans, investigate your server, and make informed changes in one open-source workspace.
macOS · Windows preview / Apache-2.0


Follow a question from the execution plan to the query, then to the server behind it.

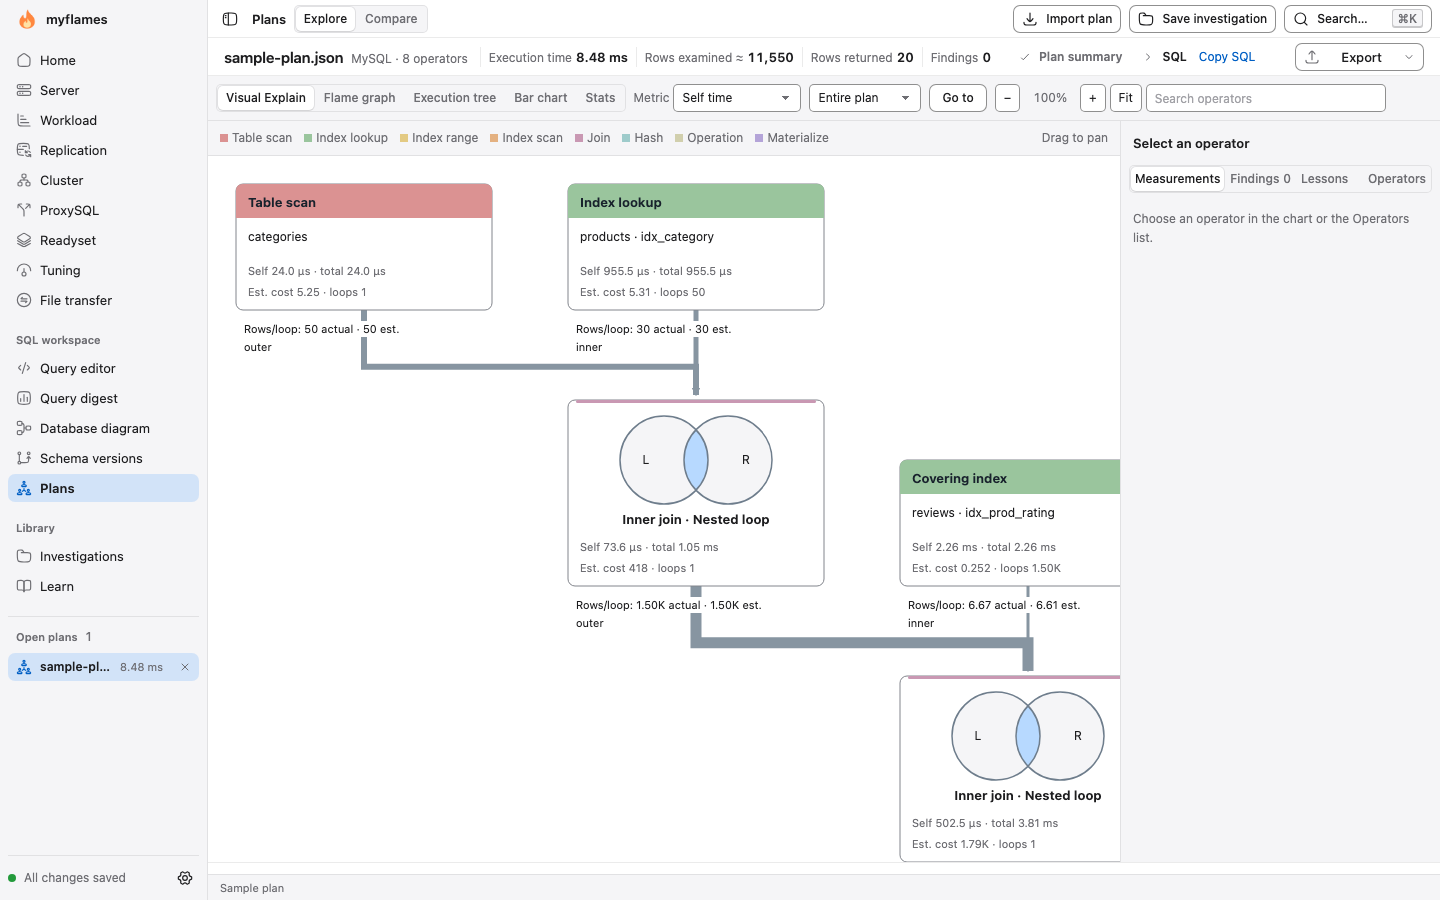
Switch between Visual Explain, flame graphs, execution trees and bar charts. Follow operator timings, inspect findings, and compare before and after plans.
Open a saved plan, capture one from a live connection, or find an expensive statement in Query digest. Slow log files work offline, too.
Inspect operators and measurements. Save the original plan, make a considered change, then compare the two captures side by side.
Export a plan as a standalone HTML report or JSON for a teammate. Hide literal values before sharing a plan.
A performance question rarely ends at a single operator. Keep the surrounding evidence close.
Explore database diagrams, save schema versions and compare definitions across servers. Review generated sync scripts before using them.
Explore schemas ↗Inspect live metrics, InnoDB, waits, I/O, active sessions and blocking trees. Use Tuning for configuration checks and a full analysis report.
Explore server diagnostics ↗Production, Development and Read-only connection policies. Review exact SQL for protected actions and keep a local audit trail.
Understand write safety ↗Step through guided lessons with simplified code and short quizzes. Build intuition for joins, scans, indexes and the buffer pool.
Explore Learn ↗A query plan tells a story. You should be able to see it, question it, and explain it to the next person.
myflames brings visual analysis, server evidence and guided learning into the same workspace. For the developer reading a first plan, and the DBA following a difficult one.
The thinking behind myflames ↗myflames is licensed under Apache-2.0. Explore how a finding is produced, build from source, report an engine difference, or help make the next investigation clearer.
Saved investigations and audit records live on your computer. Database connections go to the servers you configure.
Export plans as standalone HTML reports or JSON, with literal values hidden when you share them.
Inspired by Brendan Gregg's FlameGraph and Tanel Poder's SQL Plan FlameGraphs. Their work is part of this project's foundation.
Download the desktop app. Start with a saved plan whenever you're ready.
Installation & first steps ↗MySQL 5.7+, MariaDB 10.11+ and Percona Server are supported, with capabilities depending on the engine and version. Timed MySQL JSON plans require MySQL 8.3+; 5.7 and 8.0 use estimated JSON plans. MySQL 5.7 is end of life. See the compatibility guide.
You can analyze exported plan files and slow query log files offline. Live capture, the Query editor and server views need a configured connection and a local mysql or mariadb client.
Yes, when you use its write features. Read-only connections refuse changes. Production connections confirm every change; Development confirms risky changes. Protected operations review exact SQL and record an audit event. Timed plan analysis runs the SELECT, so review its cost before using it. Read the safety guide.
The performance workspace ships as a desktop app. This website introduces the project and hosts documentation. Plans can export a standalone HTML report that opens in any browser.
Yes. Current versions are licensed under Apache-2.0, and you can build from the public source. Versions up to 2.3.0 retain their historical CDDL-1.0 license. Read the license.
Meet Ember, a warm and curious companion for the investigation. Small, approachable, and happy to help you understand the next plan. Meet Ember and explore the brand assets.