
See what your database is doing.
**myflames** is an open-source performance workspace for MySQL, MariaDB, and Percona Server for MySQL. Follow a question from the query plan to the SQL, schema, and server behind it. Inspect operator timings, compare before and after plans, and share the evidence with your team. Use the desktop app on macOS or the Windows x64 preview. The former Python command line and `myflames-mcp` agent tools are deprecated: they keep working for existing users but are no longer developed or documented. Visual Explain diagrams, flame graphs, execution trees, and bar charts make plans easier to read; server diagnostics, CI checks, and read-only MCP tools carry the investigation further. Inspired by [Brendan Gregg's FlameGraph](https://github.com/brendangregg/FlameGraph) and [Tanel Poder's SQL Plan FlameGraphs](https://tanelpoder.com/posts/visualizing-sql-plan-execution-time-with-flamegraphs/). ## Screenshots  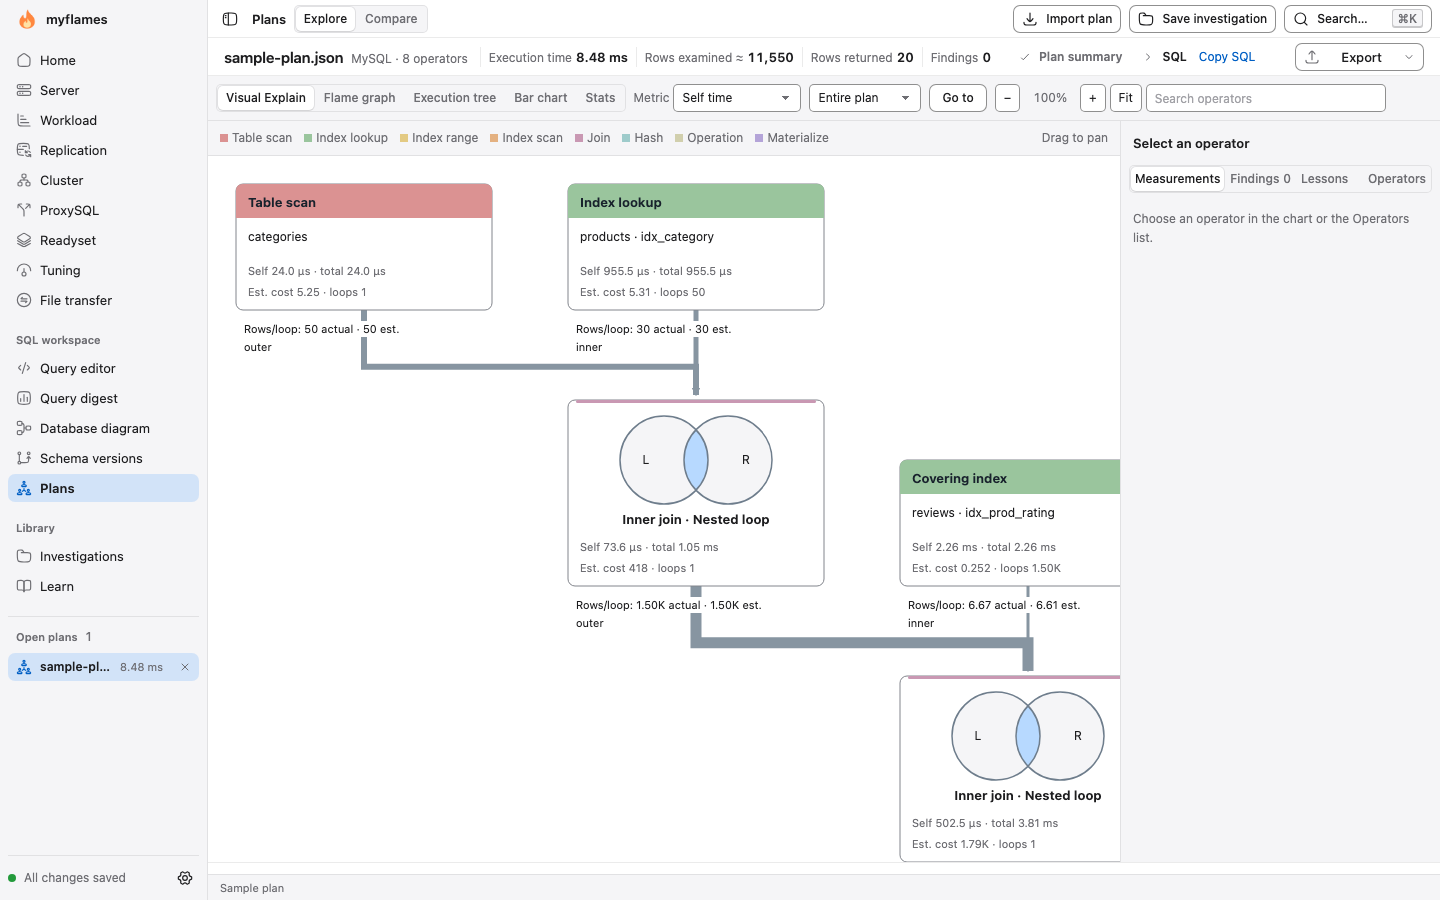   Try a [MySQL plan demo](https://vgrippa.github.io/myflames/demos/live-mysql/live-mysql-derived-table-flamegraph.html) or a [MariaDB plan demo](https://vgrippa.github.io/myflames/demos/live-mariadb/live-mariadb-derived-table-flamegraph.html) in your browser. ## Highlights Follow the [How-to guides](https://myflames.io/docs/howto.md) for Query editor tasks, settings, themes and layout, with short recordings. - **Plans and plan comparison**: Inspect `EXPLAIN ANALYZE FORMAT=JSON` and `EXPLAIN FORMAT=JSON` plans as Visual Explain diagrams, flame graphs, execution trees or bar charts, with ranked findings, operator search and interactive algorithm lessons in Learn (each one steps through the algorithm with simplified code beside the drawing and ends with a short quiz). Save captures into Investigations and compare before and after plans side by side in Compare. Flame graph color intensity follows each frame’s own measured time, with neutral frames when timing is unavailable. Workspace startup restores quietly; Settings > Start fresh opens a confirmation to reset the workspace. The Stats view totals time per table and per operator type, **All occurrences** gathers every place one operator appears, and exports can hide literal values before you share a plan. In a measured plan, eligible base-table accesses and filters directly above them are marked in violet when actual and estimated rows per loop differ by at least 10x and the larger count times loops reaches 1,000 rows; overestimates below early-stop ancestors are skipped, and MariaDB compares only eligible index lookups and only underestimates: **Misestimates** in the plan's measurements steps through them, worst ratio first (saying when the bar chart omits an operator with no self time), and the inspector shows the estimate against the actual rows, the table's InnoDB statistics when the plan was captured from a live server and the operator's table maps unambiguously to a single base table in the captured schema evidence, and the `ANALYZE TABLE` statement to copy (myflames never runs it). - **Query editor, Query digest and Database diagram**: Run SQL across multiple tabs with dedicated sessions, a **Database** picker whose **None** choice survives restore and starts the next session without a default schema, **Open SQL file…** (`⌘O`) and Save / Save as (`⌘S`, `⇧⌘S`) for `.sql` and `.txt` files (Open up to 5 MiB, Save refusing symbolic-link targets and changed folders, with Save as recovery after a backend restart), **On error: Stop / Continue** in Run options for full-tab runs, with succeeded, failed, not run, stopped and unknown outcomes counted in Messages and a fresh write review when the mode changes, find and replace (`⌘F`, `⌥⌘F` / `Ctrl+H` with Match case, Whole word and Regular expression), multiple cursors, immediate suggestions for the server's own keywords and functions (accepting a function inserts `NAME()` with the cursor inside), plus cached names and names that join the open list after a background read, an argument hint such as `DATE_FORMAT(…) · 2 arguments · argument 1` inside a known call (argument counts appear when known), details on hover, problem warnings and a **Problems** list, and the Query editor settings in Settings, Explain like MySQL Workbench (the server's own `EXPLAIN` rows in Table, Tree or JSON format, in the tab's session, with Export and **Explore** for the visual plan), schema and column completion, Routines, Triggers and Events folders under each database in Schemas, preserving object names containing XML-forbidden control characters, SQL formatting, parameter binding with a fill-in form for digest values, saved queries in folders, exact totals of the selected cells, a row panel with JSON laid out, editable InnoDB table data and CSV, JSON, SQL or Markdown export. Navigate Back and Forward across views, query tabs and plans (`⌘[` / `⌘]`, plus a **Back to …** chip after following a cross-link), and use `⌘K` to jump to recent destinations or search databases, tables, views, routines, triggers and events on the connection in use. A plan that needs the tab's session (a temporary table, a user variable, a prepared statement) can be captured in that session instead of failing. Before an ALTER TABLE runs, its review predicts whether the server will run it INSTANT, INPLACE (with or without a table rebuild) or COPY, and whether writes can continue, with the reason for each clause. Summarize statement digests in Query digest, ranked against the server's total statement time, with P95, P99 and P99.9, a latency histogram and CPU time on MySQL, and the size and indexes of the tables a statement names (read when a statement opens with the Slow log table source); Workload > Top statements and Query digest share one statement inspector (Statement, Latency, Rows, Flags, Suggested index, Actions), with **Read suggestion** to request the estimated-plan check (planning can evaluate expressions), reuse of a fresh result on reopening and **Read again** for a new read. Opening a suggested `CREATE INDEX` in the Query editor keeps the statement's before average latency and rows examined on the tab and offers **Measure the statement again** (and **Compare plans** when an earlier capture is in memory) after the index is created; inspect or export entity-relationship diagrams in Database diagram. Query digest has a **Source** choice: Statement digests (Performance Schema), **Slow log table** (`mysql.slow_log`) or **Slow log file** (a MySQL 5.7 to 9.x, Percona Server or MariaDB slow query log on this computer, summed by statement fingerprint with no server), and a **Time range** with a calendar and quick ranges. After a run, the editor reports what the server did per statement (rows examined, returned and changed, scans, joins without an index, temporary tables on disk), and an open transaction shows its age, changed rows and the sessions waiting on its InnoDB locks, with Commit and Roll back in its popover. Loaded results can be filtered in place with text and column value chips, pinned, and compared against a later result in the same tab, all without running the query again. - **Import CSV**: Load a .csv, .tsv or .txt file into an existing table or a new one, from the Query editor's Schemas panel (a table's menu: **Import CSV…**; a database's menu: **Import CSV into a new table…**) or from Server > Tables (row menu and inspector). The sheet detects the separator, encoding and header row, checks every row against the column types before anything is sent, and lists problems by line. Rows go as batched INSERT statements by default; LOAD DATA LOCAL is offered only when the server already has `local_infile` ON, and myflames never changes that setting. If a row fails or you stop the import, you choose to keep nothing (one rolled-back transaction) or to keep the rows committed every N rows, and bad rows can stop the import or be skipped and reported. Every import is a reviewed and audited write, and the Audit log never stores row data. - **Schema versions**: Save the schema of a database on this computer and compare any two schemas: saved versions, exported files, or databases read now, on the same server or on different ones. A comparison has a source, the schema to match, and a target, the schema that would change: each object is listed as different, only in the source or only in the target (columns, keys, foreign keys, options, partitioning, views, routines, triggers, events), with both definitions side by side and the sync script that would change the target to match the source, ready to review, copy or open in the Query editor. You choose which objects the script includes (objects only in the target are left out until you choose them; changes within a chosen object can still drop columns or replace the object, and they carry a `-- WARNING:` comment and the Drops data label), each change says whether it drops data, may fail on existing rows or rebuilds the table (each ALTER TABLE carries its predicted INSTANT, INPLACE or COPY algorithm as a comment), and **Checks** flag risky definitions such as FLOAT money columns, utf8mb3, MyISAM or a foreign key without an index. myflames never runs the script. **Export as SQL…** turns a saved version, or a database read now, into a script that recreates the schema on another server (tables in foreign key order, definers left out unless you keep them); it is never run either. - **Server views and Tuning**: Check live metrics in Health (with live charts, and **Capture when…** to save the processlist, InnoDB status and locks into an investigation when threads pile up or a lock wait or statement runs long), InnoDB, Error log, Waits, I/O, Indexes, Tables, Parameters (linked to official MySQL, MariaDB and Percona manuals) and Instruments, or refresh all views at once. Compare parameters between two servers or against a saved snapshot, and in **Versions** compare two MySQL or MariaDB releases, or trace one parameter through every cataloged release, from catalogs shipped with myflames. Open Tuning for configuration checks and the Full analysis report. **Table structure** in Tables shows one table's columns, indexes, foreign keys and exact `SHOW CREATE TABLE`. **Fragmentation** in Tables ranks InnoDB tables by the space a rebuild could reclaim, with the `OPTIMIZE TABLE` and `ALTER TABLE ... ENGINE=InnoDB` statements to copy or review in the Query editor. Health refreshes itself while it is visible (Auto-refresh defaults to **While visible**, waiting one full interval after each completed read, keeping another connection's greyed report until **Refresh**, and reading immediately on return unless a failure backoff is still pending). **Memory** (Workload > Resources) shows tracked allocations by category, session and account in binary units, with the exact bytes beside each value in the inspector, growth over a short window and row-specific status pills; general rules of thumb live once in the notes (ⓘ), and **By session** opens when categories were not collected but sessions were. Health and Query digest keep **baselines**: save the reading on screen on this computer (requiring the server identity verified with the reading to match the server reached when saving), then compare a later reading against it, tied to the server's own identity (`server_uuid` on MySQL, `hostname:port` on MariaDB, read in the same call; Query digest compares average latency only after a restart or a forward move in `oldest_first_seen`). - **File transfer**: Move logs, dumps and configuration files between this computer and your servers over SSH/SFTP, in a place of its own with two panes side by side (this computer and the server), like FileZilla. Save **SSH connections** of their own (host, port, user, and sign-in with your SSH agent, a key file with an optional passphrase, or a password), started from a database connection or a `~/.ssh/config` alias; a password or passphrase you save is kept in the platform credential store. The first connection to a server shows its host key fingerprint to compare before you trust it; myflames keeps trusted keys in its own file and never edits `~/.ssh/known_hosts`. Right-click a saved SSH connection to open, edit, duplicate, test, copy or delete it. Browse with breadcrumbs, a filter, sorting and Finder-style selection; **Reveal in Finder** (**Show in File Explorer** on Windows) on files of this computer; drag files and folders between the panes or from the Finder; create, rename and delete; and follow every transfer (folders included) with progress, rate, time left, Cancel and Retry. Downloads are staged so a stopped one never leaves a half-written file. - **Processlist and Locks**: Inspect active connections, open transactions and running queries in Processlist, follow the stage, percentage and time left of a running ALTER TABLE, explain a live session's statement, or end runaway queries with single or bulk Kill. Processlist shows who each session waits on and how many sessions it blocks in its Lock / Trx column, with the **Root blocker** pill first in the cell and root blockers first under the Locked filter; a session's inspector follows the blocking chain and loads its recent statements, and the Kill sheet keeps **What to end** below **Statement to send** and explains what each mode does to the session's transaction and the sessions it blocks. Trace blocking trees, waiting DDL, metadata locks, InnoDB row locks and the latest deadlock in Locks. Ages and waits use readable durations; exact seconds are on hover in duration tables, Processlist detail facts and Locks summary facts (see [the workspace guide](https://myflames.io/docs/ref-local-ui.md)). - **Replication, Cluster, ProxySQL and Readyset**: Explore dimensional multi-tier topology views spanning ProxySQL, Readyset and MySQL or MariaDB standalone servers, replicas and clusters, with selectable nodes, connection switching and cross-place navigation. Monitor replica channels, GTID positions, applier workers and lag in Replication, and skip one failed transaction or run a bounded skip loop after review. Inspect MariaDB Galera, Percona XtraDB Cluster, MySQL InnoDB Cluster and Group Replication topology and member actions in Cluster, inspect backend pools, QueryPilot rules and digests in ProxySQL, or inspect Readyset shallow and deep caches, cached versus upstream latency percentiles, proxied query cacheability (`EXPLAIN CREATE CACHE`), base-table CDC replication, re-snapshotting and dynamic `ALTER READYSET` parameters in Readyset. - **Users and roles**: List accounts and roles without exposing password hashes, inspect effective grants and privileges, and create, drop, rename, lock, expire passwords or change grants and roles after reviewing the exact SQL and before-and-after grant diff. Compare accounts between two servers and export the chosen accounts' grants as SQL without passwords. - **Maintenance**: **Used for this server** shows the program, version, origin and reason for queries, dumps and restores, plus MySQL Shell when available. **Settings > Client tools…** controls the choice per engine. Find every local tool copy as soon as Maintenance opens (vendor updates on request), run pre-upgrade checks against target versions read from the vendor (MySQL release notes, or Percona's package repositories for Percona Server) along MySQL's upgrade paths, with how the server was installed (RPM, DEB, Ubuntu's package or a generic archive) and what that means for the upgrade, and start dumps, restores and MySQL `CLONE` jobs from one button per task (**Start dump…** checks first and suggests a new dated output folder) with cancellation and manifest verification. A running job shows a progress bar (MySQL Shell's own percent, or for an SQL dump the bytes written beside the server's size estimate), the step it is on and the elapsed time, next to the Start button too; a completed dump opens its folder in Finder (on Windows, **Open in File Explorer** opens it). - **Connections, write safety and the audit log**: Every connection is Production (confirms every change), Development (confirms risky changes such as DDL, `KILL`, `SET GLOBAL`, replication skips and `CLONE`) or Read-only (refuses all changes before connecting), shown as a strip along the top of the window and on every review sheet. A connection can reach its server through an SSH tunnel with your own `~/.ssh/config`, keys and agent. Home's Connections table labels its default-database column **Database** (tooltip "Default database") and keeps product and version ahead of the stale-time hint in **Server**. It shows the last known facts of each server (product, version, replication or cluster role, read-only and Performance Schema state), refreshed by Test connection or **Check now**, and imports connections from MySQL Workbench or DBeaver without passwords in a wider preview that marks duplicates and shows alerts only for errors. Every confirmed, refused or declined change is recorded in the local Audit log (`Settings > Audit log`) without passwords, and the inspectors of Parameters and Users and roles show the latest change recorded there for the selected object, with readable operation names, the hint "Kept on this computer.", the stored SQL beside Copy, and the exact record one click away. ## Install ### macOS app 1. Download `myflames-3.4.1-macos-arm64.dmg` from [GitHub Releases](https://myflames.io/download.html) (Apple Silicon), open it, and drag `myflames.app` to `/Applications`. 2. Double-click `myflames.app`. It is signed with a Developer ID and notarized by Apple, so macOS opens it without extra steps. Releases before 3.3.0 were unsigned zips: Control-click those in Finder and choose **Open** the first time. The packaged app keeps its data under `~/Library/Application Support/myflames-desktop`, unless overridden by `MYFLAMES_DESKTOP_DATA`. Its workspace database and audit records are in `backend-home/.myflames/workspace.sqlite3`; saved passwords use `credentials.vault` and `vault.key` in that same `.myflames` folder, and SSH host keys you trust in **File transfer** are kept in `ssh_known_hosts` there. The app keeps itself up to date: with **Settings > Check for updates automatically** on (the default) it checks at start and once a day, a badge beside the logo shows a newer release, its download progress and when it is ready, and **Update** followed by **Restart to update** installs it in place (on macOS, keep `myflames.app` in your Applications folder; on Windows the update installs silently when the app quits). You can also check on demand with **Check for updates** on Home or in **Settings > About myflames**. ### Windows app (preview) 1. Download `myflames-3.4.1-windows-x64-setup.exe` from [GitHub Releases](https://myflames.io/download.html) and run it. It installs for your user only, with no administrator prompt, and adds Start menu and desktop shortcuts. 2. The installer is not code signed yet, so SmartScreen says "Windows protected your PC" the first time: choose **More info**, then **Run anyway**. The Windows app is a preview: it has been tested on Windows 11 x64, but a crash can leave a statement that was already running on the server until it finishes. SSH tunnels end with the app however it stops; a dump, restore or clone that was running when the app crashed keeps going until it finishes. In **File transfer**, Windows can browse servers and folders, sign in with the SSH agent or a key without a passphrase, and rename, create and delete on the server, but uploads and downloads are not available yet (their safe local file handling needs macOS or Linux). Its data lives in `%APPDATA%\myflames-desktop`. Uninstall it from **Settings > Apps**. The app includes the official MySQL 8.4 LTS client (`mysql` and `mysqldump`) and finds installed tools on PATH and in standard installation folders. For each server, automatic selection uses its engine and major.minor series first (authentication plugins, then newest patch, then installed before bundled), otherwise the nearest newer series or the newest older series with a warning; MariaDB accounts using `ed25519` or `parsec` need MariaDB client tools. **Settings > Client tools…** shows the programs used for the connection in use and lets you keep **Automatic (best match for each server)** or choose an installation separately for MySQL and MariaDB servers; an unavailable choice is reported without switching to another installation. While Home is open, the app fetches up to six headlines from Planet MySQL and the MariaDB Foundation over HTTPS and caches them for six hours. Turn this off in **Settings** with **Show MySQL and MariaDB news on Home**; nothing is fetched while it is off. Settings opens as a page from the gear at the bottom of the sidebar, **⌘,** (**Ctrl+,** on Windows and Linux) or the command palette, with sections for Appearance, Query editor, Workspace, Updates and news, and Client tools. ## Engine compatibility | Capability | MySQL 5.7 | MySQL 8.0 | MySQL 8.4 and 9.x | MariaDB 10.11+ and 11.x | Percona Server 8.0 and 8.4 / PXC | | :--- | :--- | :--- | :--- | :--- | :--- | | **Offline plan files** | `EXPLAIN FORMAT=JSON` (the `query_block` format; no operator timing) | `EXPLAIN FORMAT=JSON` (cost estimates; no operator timing) | `EXPLAIN ANALYZE FORMAT=JSON` and `EXPLAIN FORMAT=JSON` | `ANALYZE FORMAT=JSON` and `EXPLAIN FORMAT=JSON` | 8.0: `EXPLAIN FORMAT=JSON`; 8.4: `EXPLAIN ANALYZE FORMAT=JSON` | | **Live plans (Explain, Explore, Run analysis)** | Estimated plans only (`EXPLAIN FORMAT=JSON`); Run analysis is refused because 5.7 has no `EXPLAIN ANALYZE` | `EXPLAIN FORMAT=JSON`; Run analysis is refused before sending (`EXPLAIN ANALYZE FORMAT=JSON` is 8.3+) | Estimated and timed plans, schema, statistics, variables and trace | Estimated and timed plans, schema, statistics, variables and trace | 8.0: `EXPLAIN FORMAT=JSON`; 8.4: `EXPLAIN ANALYZE FORMAT=JSON` | | **Query editor, Query digest, Database diagram** | SQL sessions and schema diagrams; Query digest Statement digests have no sample text, quantiles or CPU time on 5.7, and the Slow log table and Slow log file sources work | SQL sessions, digest summaries and schema diagrams | SQL sessions, digest summaries and schema diagrams | SQL sessions, digest summaries and schema diagrams | SQL sessions, digest summaries and schema diagrams | | **Schema versions** | Read, compare, sync script and Export as SQL; Checks leave reserved words Not judged before 8.0.11 | Tables, views, routines, triggers and events from `SHOW CREATE`; sync script; Checks (current reserved words need a live 8.0.11+ connection) | Same (JavaScript libraries of 9.2+ are not read) | Same, plus sequences, packages and system-versioned tables (sequence and versioning changes are listed but not generated); Checks leave reserved words Not judged | Same as MySQL | | **Server views, Processlist, Locks, Tuning** | Server diagnostics; Locks reads `INNODB_LOCKS` and `INNODB_LOCK_WAITS`; Error log gets file guidance; Parameters have no sources and no `SET PERSIST` | Server diagnostics; `performance_schema.error_log` requires 8.0.22+; older 8.0 gets file-viewing guidance | Server diagnostics | `userstat` fallbacks for index usage and table I/O when enabled; Waits requires Performance Schema. `metadata_lock_info` for MDL; verified local error log file or guidance | Server diagnostics plus Percona `userstat` index and table stats, thread-pool metrics, `log_slow_rate_limit` checks and Percona parameter links | | **Replication and Cluster** | Replication (`SHOW SLAVE STATUS`), Group Replication from 5.7.17; reviewed Cluster changes need 8.0.13 | Replication (`SHOW REPLICA STATUS` / `SHOW SLAVE STATUS`), InnoDB Cluster, Group Replication | Replication (`SHOW REPLICA STATUS`), InnoDB Cluster, Group Replication | Replication (`SHOW ALL SLAVES STATUS`, `gtid_slave_pos`), MariaDB Galera Cluster | MySQL Replication, Group Replication, Percona XtraDB Cluster (`wsrep_*`, `pxc_cluster_view`) | | **Users and roles** | Users only (5.7.6+); no roles | Users, roles, default roles, partial revokes and dynamic privileges | Users, roles, default roles, partial revokes and dynamic privileges | Users, MariaDB roles, `SET DEFAULT ROLE` and `PUBLIC` | MySQL privilege and role model | | **Maintenance** | Upgrade check, dump and restore (structure only included); no `CLONE` | Upgrade check (`mysqlsh` or partial native subset), dump, restore, `CLONE` (8.0.17+) | Upgrade check, dump, restore, `CLONE` | Dump and restore (`mariadb-dump`); points to `mariadb-upgrade` and `mariadb-backup` for upgrades and physical copies | Upgrade check, dump, restore, `CLONE` (Percona Server) | For manual MySQL JSON generation on 8.3+, select format version 2 with `SET SESSION explain_json_format_version=2` before EXPLAIN. Timed JSON analysis needs MySQL 8.3 or later (8.4 LTS); on earlier versions myflames refuses it before sending anything. MySQL 5.7 is end of life; myflames reads it and says in plain sentences what 5.7 lacks (roles, `SET PERSIST`, `EXPLAIN ANALYZE`, `CLONE`, `performance_schema.error_log`, invisible indexes). A MySQL 5.6 or older server gets a note that results may be missing or wrong. ProxySQL 2.x and 3.x are supported in the ProxySQL place when connected to a ProxySQL Admin interface. Readyset is supported in the Readyset place when connected to a Readyset SQL listener (default port 3307) or admin SQL listener (default port 6036). ## Appearance Choose a theme in **Settings > Appearance**, where a card per theme previews its colors, or open **Search…** (⌘K on macOS, Ctrl+K on Windows) and type **Theme:**. Available themes are System, Light, Dark, Fire, Digital Rain, Neon Grid, Dracula, Nord, Solarized Light, Solarized Dark, Tokyo Night, Gruvbox Dark, Catppuccin Mocha, Catppuccin Latte, GitHub Light, GitHub Dark and One Dark. The choice is kept on this computer and applies to navigation, views, tables, dialogs, the Query editor and charts. System follows your operating system's light or dark appearance. Editor palettes are adapted for readable text and selections. Chart operator colors, status meanings and Production (purple) and Development (teal) connection colors keep their meaning in every theme. Palette credits and licenses are in [NOTICE](https://myflames.io/docs/source/NOTICE). Drag the sidebar's right edge to resize it, or focus the edge and use the arrow keys. Double-click, Home or End restores its default width. Sidebar and Server inspector widths, the Server view navigation choice, Health auto-refresh, Query editor Explain format, and File transfer hidden-file and Transfers-panel choices survive app restarts. Narrow windows keep the compact navigation rail. The window status bar shows the installed version and update status on every screen, with **Check for updates** and **View releases** beside the current view's facts. ## Documentation | Guide | Contents | | :--- | :--- | :--- | | [docs/handbook/README.md](https://myflames.io/docs.html) | Project-owned handbook: installation, plans, queries, schemas, diagnostics, write safety, compatibility, learning and contributing; also rendered by the separate website. | | [docs/LOCAL_UI.md](https://myflames.io/docs/ref-local-ui.md) | Complete guide to the workspace places, Server views, Replication, Cluster, ProxySQL, Readyset, Users and roles, Maintenance, connections and SSH tunnels, write safety and the Audit log. | | [docs/QUERY_WORKSPACE.md](https://myflames.io/docs/ref-query-workspace.md) | Query editor, SQL completion, table data editing, Query digest, Database diagram, Schema versions, live capture modes and saved credentials. | | [docs/VISUAL_EXPLAIN_REFERENCE.md](https://myflames.io/docs/ref-visual-explain-reference.md) | Operator color key, metrics and advisor rules across the plan views (see also [docs/WORKBENCH_VIEW.md](https://myflames.io/docs/ref-workbench-view.md)). | | [docs/DEVELOPER_REFERENCE.md](https://myflames.io/docs/ref-developer-reference.md) | Architecture, JSON schemas, parser and advisor contracts, write-safety invariants and testing guide. | | [docs/DESKTOP.md](https://myflames.io/docs/ref-desktop.md) | macOS Electron desktop app packaging, process lifecycle, client discovery and storage layout. | | [Release notes](https://myflames.io/docs/release-notes.md) | What changed in each version, newest first. | | [CHANGELOG.md](https://github.com/vgrippa/myflames/blob/master/CHANGELOG.md) | Changes merged since the last release. | | [test/README.md](https://github.com/vgrippa/myflames/blob/master/test/README.md) | Plan fixtures, live replay fixtures and test suite instructions. | ## License and credits myflames is licensed under the [Apache License, Version 2.0](https://myflames.io/docs/source/LICENSE) (see [NOTICE](https://myflames.io/docs/source/NOTICE)). Releases up to 2.3.0 were distributed under CDDL 1.0; the flame graph renderers (`myflames/flamegraph.py` and `apps/workspace/src/charts/flamegraph.ts`) were rewritten clean-room from a functional specification for 2.4.0. Inspired by [Brendan Gregg's FlameGraph](https://github.com/brendangregg/FlameGraph) and [Tanel Poder's SQL Plan FlameGraphs](https://tanelpoder.com/posts/visualizing-sql-plan-execution-time-with-flamegraphs/). Brendan Gregg's FlameGraph and Tanel Poder's SQL Plan FlameGraphs are the original inspiration for this work.